Average Rate of Change
Pronunciation: /ˈæv.rɪdʒ reɪt ɒv tʃeɪndʒ/ Explain
|
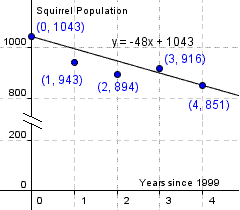
The average rate of change of a data set is the average of each change from one period to the next period. For the data in table 1, the average rate of change is -48. This means that from 1999 to 2003, the squirrel population went down on average 48 squirrels per year. Average rate of change can be used to create a constant growth model. An equation modeling growth for this data is p = -48y + 1043 where y is the years since 1999 and p is the model's estimate of growth. Figure 1 shows each point in the dataset and the equation using the constant growth model. Note that the average rate of change is also the slope of the line modeling the data. |
| ||||||||||||||||||||||||||
Discovery
|
Click on the blue points and drag them to change the figure. |
| Manipulative 1 - Average Change Created with GeoGebra. |
Find the value of average rate of change in the algebra window on the left. Now click on the aqua (middle) points and drag them. Does average change change? Click on the blue (end) points and drag them. Does average change change?
Why does average rate of change change only when the end points are moved? Write a formula for average rate of change that uses only the end points.
Click on the points in the dataset and drag them so that the line is close to the points. What characteristics would a dataset have that is modeled well using a constant growth equation?
Click on the points in the dataset an d drag them so that the line is far from the points. What characteristics would a dataset have that is not modeled well using a constant growth equation?
References
- McAdams, David E.. All Math Words Dictionary, average rate of change. 2nd Classroom edition 20150108-4799968. pg 22. Life is a Story Problem LLC. January 8, 2015. Buy the book
More Information
- McAdams, David E.. Growth. allmathwords.org. All Math Words Encyclopedia. Life is a Story Problem LLC. 6/19/2018. http://www.allmathwords.org/en/g/growth.html.
Cite this article as:
McAdams, David E. Average Rate of Change. 4/12/2019. All Math Words Encyclopedia. Life is a Story Problem LLC. http://www.allmathwords.org/en/a/averagechange.html.Image Credits
- All images and manipulatives are by David McAdams unless otherwise stated. All images by David McAdams are Copyright © Life is a Story Problem LLC and are licensed under a Creative Commons Attribution-ShareAlike 4.0 International License.
Revision History
4/12/2019: Changed equations and expressions to new format. (McAdams, David E.)12/21/2018: Reviewed and corrected IPA pronunication. (McAdams, David E.)
6/15/2018: Removed broken links, changed Geogebra links to work with Geogebra 5, updated license, implemented new markup. (McAdams, David E.)
1/7/2010: Replaced phrase 'average change' with phrase 'average rate of change'. (McAdams, David E.)
10/7/2008: Added coloring of numbers. (McAdams, David E.)
6/27/2008: Expanded verbiage and added graph comparing model and data. (McAdams, David E.)
3/5/2008: Initial version. (McAdams, David E.)
- Navigation
- Home
- Contents
-
# A B C D E F G H I J K L M N O P Q R S T U V W X Y Z - Teacher Aids
- Classroom Demos
- How To
- LIASP
- LIASP Home
- Conditions of Use
- Privacy Policy
- Donate to LIASP
- Help build this site
- About LIASP
- Contact LIASP
All Math Words Encyclopedia is a service of
Life is a Story Problem LLC.
Copyright © 2018 Life is a Story Problem LLC. All rights reserved.
This work is licensed under a Creative Commons Attribution-ShareAlike 4.0 International License
