Quadratic Equation
Pronunciation: /kwɒˈdræ.tɪk ɪˈkweɪ.ʃən/ Explain|
Click on the blue points on the sliders and drag them to change the figure. For what value of 'a' does the plot produce a straight line? |
| Manipulative 1 - Quadratic Equation Created with GeoGebra. |
A quadratic equation is an equation of a polynomial of degree two. When graphed, a quadratic equation makes a parabola with a horizontal directrix.
The standard form of a quadratic equation is f(x) = ax2 + bx + c where a, b and c are constant coefficients and a ≠ 0. The equation in figure 1 placed in standard form is f(x) = x2 + 2x + 0. Manipulative 1 shows the graph of a quadratic equation using the standard from.
Discovery
- Move the slider for a until a = 0. What is the result? Why is the condition a ≠ 0 placed on the quadratic equation?
- What changes in the graph when a is changed?
- What changes in the graph when b is changed?
- What changes in the graph when c is changed?
Examples of Quadratic Equations | |
| Quadratic equations | Reason |
|---|---|
| y = 3x2 - 2x - 4 | Function is a polynomial of degree 2. |
| y = -x2 - 3 | Function is a polynomial of degree 2. |
| g = b2 | Function is a polynomial of degree 2. |
| y = sin( π / 2 )x2 + 4 | Function is a polynomial of degree 2. Since the argument of the sine function is a constant, the function itself is a constant and can be treated like any other coefficient. |
| r = ( t - 1 )( t + 3 ) | The right side of the equation can be expanded using the distributive property of multiplication over addition and subtraction to yield r = t2 + 2t - 3, which is a polynomial of degree 2. |
Examples of Equations That Are Not Quadratic | |
| Non-quadratic equations | Reason |
| y = 3x3 + 2x2 - x + 3 | Function is a polynomial of degree 3, so it is not quadratic. |
| y = x2 - sin( x ) + 3 | Since sin( x ) is in the equation, it is not a polynomial. |
| w = 3m - 4 | Function is a polynomial of degree 1, so it is not quadratic. |
| y = log( 2x2 - x + 3) | Since the equation contains a logarithm with a variable argument, it is not a polynomial. |
| y = x( x - 2 )( x + 1 ) | The right side of the equation can be expanded to y = x3 - x2 - 2x, which is a polynomial of degree 3. |
| Table 1 | |
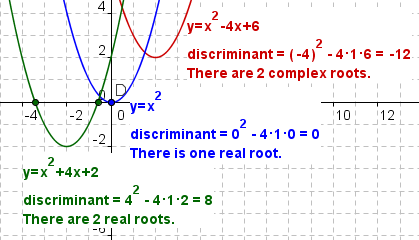
Discriminant of a Quadratic Equation
|
The discriminant of a
quadratic equation is used to determine if a quadratic equation has real or complex
roots. The expression for the discriminant is
 . . |
Solutions to a Quadratic Equation
For a quadratic equation in the form  ,
the solution can be found using the quadratic formula
 .
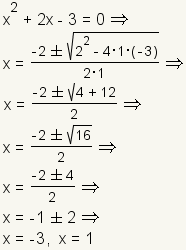
.Example 1: Two real roots.
|
|
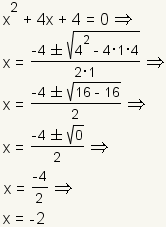
Example 2: One real root.
|
|
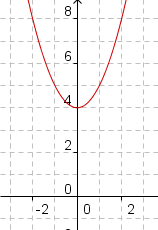
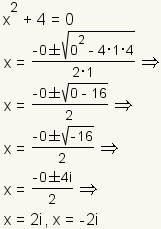
Example 3: Two complex roots.
|
|
Forms of Quadratic Equations
|
Standard FormThe standard form a parabolic equation is y = ax2 + bx + c. Discovery
|
|
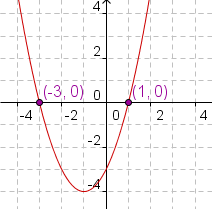
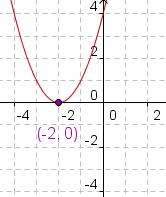
X-intercept FormX-intercept form of a parabolic equation is y = a( x - x1 )( x - x2 ) where x1 is one x-intercept of the quadratic equation, x2 is the other x-intercept, and a indicates how steep the sides of the quadratic equation are. If x1 = x2, the quadratic equation intercepts the x-axis only once. Not all quadratic equations can be described using the x-intercept form. Manipulative 3 shows a quadratic equation with elements of the x-intercept form. Discovery
|
|
Vertex FormThe vertex form of a parabolic equation is y - y1 = a( x - x1 )2. The vertex of the quadratic equation is at the point ( x1, y1). a shows how steep the sides of the quadratic equation are. Discovery
|
Graphing a Quadratic Equation
The graph of a quadratic equation can be drawn using the definition of a parabola: All points in a plane equidistant from a line, called the directrix, and a point, called the focus, which is not on the line. Every quadratic equation also has a vertex and a line of symmetry.
Discovery
- How is the quadratic equation different if the focus and directrix are close together as opposed to far apart?
- How does the quadratic equation change if the focus is moved to the left or to the right?
- Click on the focus (purple point) and drag it until the focus is on the directrix. What happens to the quadratic equation? When this happens, mathematicians say that the line is a degenerate quadratic equation.
Parts of a Parabola
|
The vertex of a quadratic equation is at the inflection point of the quadratic equation. The inflection point is the point where the parabolic curve changes direction. In manipulative 6, the vertex is orange. The distance from the focus to any point on the quadratic equation is the same as the distance from that point to the directrix. Show the focus and directrix by clicking on the checkboxes, then drag the blue point on the parabola to demonstrate this property. |
References
- McAdams, David E.. All Math Words Dictionary, quadratic equation. 2nd Classroom edition 20150108-4799968. pg 148. Life is a Story Problem LLC. January 8, 2015. Buy the book
More Information
- McAdams, David E.. Parabola. allmathwords.org. Life is a Story Problem LLC. 4/17/2009. http://www.allmathwords.org/en/p/parabola.html.
Cite this article as:
McAdams, David E. Quadratic Equation. 4/29/2019. All Math Words Encyclopedia. Life is a Story Problem LLC. http://www.allmathwords.org/en/q/quadraticequation.html.Image Credits
- All images and manipulatives are by David McAdams unless otherwise stated. All images by David McAdams are Copyright © Life is a Story Problem LLC and are licensed under a Creative Commons Attribution-ShareAlike 4.0 International License.
Revision History
12/21/2018: Reviewed and corrected IPA pronunication. (McAdams, David E.)12/3/2018: Removed broken links, updated license, implemented new markup, updated geogebra app. (McAdams, David E.)
8/7/2018: Changed vocabulary links to WORDLINK format. (McAdams, David E.)
1/22/2009: Added figure to section on discriminants. (McAdams, David E.)
12/10/2008: Added section on discriminant, solutions to a quadratic equation. (McAdams, David E.)
10/19/2008: Initial version. (McAdams, David E.)
- Navigation
- Home
- Contents
-
# A B C D E F G H I J K L M N O P Q R S T U V W X Y Z - Teacher Aids
- Classroom Demos
- How To
- LIASP
- LIASP Home
- Conditions of Use
- Privacy Policy
- Donate to LIASP
- Help build this site
- About LIASP
- Contact LIASP
All Math Words Encyclopedia is a service of
Life is a Story Problem LLC.
Copyright © 2018 Life is a Story Problem LLC. All rights reserved.
This work is licensed under a Creative Commons Attribution-ShareAlike 4.0 International License
